Dale Murphy: A Natural Career Curve, Just Held On About Two Years Too Long. (Click Image to Enlarge)
March 12, 2011 Leave a comment
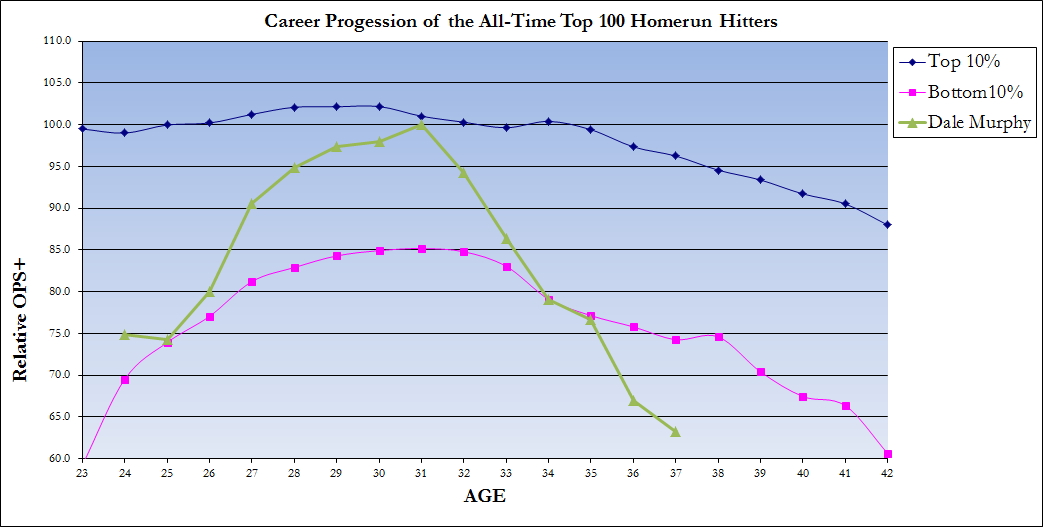
A great way to detect an abnormal career progression; it uses OPS+ as a proxy to measure overall batting skill. Relative OPS+ is measured by comparing 5-year periods of a player’s career. For instance, when 32 is seen on the age axis it represents the player’s performance from age 28 through age 32, and age 33 represents ages 29 through 33 and so on. The relative part is introduced when all of the player’s other 5-year periods are indexed to the player’s best 5-year period. The best 5-year period equals 100 and the rest of the 5-year periods are measured accordingly. The chart above displays the career progression in which 80% of players fit. A couple of things to remember when viewing the chart is that the area between the 10% lines is 80% of all players measured. Additionally, the player’s performance is compared to himself, so if Player A has an 85 rating at age 32 and Player B has an 89 rating at the same age, that does not necessarily mean that Player B was a better player; it just means Player B closer to his peak than Player A.
